Manual vs Automated Palletizing: Labor Cost, Throughput, and the Switch Decision
Manual vs automated palletizing is the end-of-line decision that determines whether a manufacturing facility absorbs rising labor costs indefinitely or reaches the point where capital investment permanently reshapes its cost structure. The two approaches differ not just in method – workers stacking by hand versus a robotic system building pallets to programmed patterns – but in how throughput ceiling, injury exposure, and workforce dependency are distributed across production operations. Manual palletizing assigns all of that exposure to human workers: their fatigue rates, their injury risk, their availability on any given shift. Automated palletizing transfers it to an engineered system: its programming accuracy, its maintenance schedule, its integration with upstream conveyors. For Malaysian manufacturers navigating structural labor shortages and government pressure under NIMP 2030 to accelerate Industry 4.0 adoption, this comparison carries a direct financial consequence. The ROI window on automation investment has shortened, and facilities that calculate the crossover point correctly today gain a permanent cost-per-unit advantage over those that delay.
The Real Cost of Manual Palletizing Extends Beyond Direct Wages
Manual palletizing is the process of workers physically lifting, orienting, and stacking products onto pallets according to load patterns – typically at the end of a packaging or production line. The visible cost is labor: wages paid per shift, per worker, per year. The actual cost runs significantly higher once the indirect expense categories are counted.
The Indirect Cost Stack Most Operations Undercount
Facilities running manual palletizing carry cost layers that don’t appear as a single line in the labor budget. These categories include:
- Workers’ compensation and insurance premiums – Palletizing is among the highest-risk manual handling tasks. Repetitive lifting at constrained postures generates musculoskeletal disorder (MSD) claims that accumulate over time and push SOCSO contributions and private insurance premiums upward.
- Training and onboarding cycles – Manual palletizing positions experience above-average turnover because of physical demand. Each replacement worker requires three to six weeks of supervised training to reach acceptable stacking speed and pallet quality, during which error rates and supervision time increase.
- Supervision overhead – Any manual operation running four or more workers per shift requires a dedicated supervisor to maintain pallet pattern consistency and catch errors before they reach the shipping dock.
- Product damage and rework – Human inconsistency in layer height, weight distribution, and overhang tolerances creates unstable pallets. Loads rejected at destination facilities – or damaged in transit – generate claims, rework, and customer escalations that land in operations costs rather than the labor budget where the root cause originated.
In Malaysia’s current manufacturing labor market, the turnover component has accelerated. Revised national minimum wage structures combined with the physical demands of repetitive palletizing mean that manual stations frequently run under-strength during peak production periods. That creates a compound problem: throughput shortfalls and quality failures occurring simultaneously at the moment production pressure is highest.
Beyond the budget categories above, manual palletizing carries a second cost layer that compounds silently – one rooted in the physical toll the task places on workers’ bodies over time.

The MSD Cost Multiplier
Palletizing combines the three risk factors that industrial ergonomics frameworks identify as primary MSD drivers: repetitive motion, heavy loading, and constrained posture – sustained across entire shifts. Per data published by the U.S. Bureau of Labor Statistics and cited across industry benchmarks, musculoskeletal disorders represented a substantial share of workplace injury cases requiring days away from work in recent years. Malaysian OSHA enforcement frameworks, increasingly aligned with international ergonomic standards under NIMP 2030’s compliance requirements, apply equivalent exposure categories.
The financial exposure from a single lost-time MSD claim – combining medical costs, replacement labor, SOCSO filing, and output shortfall – typically exceeds several months of the injured worker’s wages. For a facility running eight to twelve manual palletizing stations across two shifts, the annual MSD cost exposure becomes a material line item that standard labor cost models rarely capture at full value.
5 Operational Advantages Automated Palletizing Delivers at Production Scale
Automated palletizing systems – whether robotic arm, cobot, or conventional layer palletizer configurations – deliver five compounding operational advantages across the production lifetime of the installation.
1. Consistent Throughput Uncapped by Shift Duration
A robotic palletizing system operates at programmed cycle speed across an entire shift – 8, 16, or 24 hours – without the fatigue degradation that affects manual throughput in the second half of each shift. Throughput rates for robotic arm palletizers typically run between 10 and 60 cycles per minute (600–3,600 cycles per hour), depending on product format and cell configuration. That consistency converts production planning targets from shift-by-shift estimates into reliable inputs.
Manual palletizing throughput degrades measurably as shifts progress. Speed reduction of 15–25% in the final hours of a physically demanding shift is a documented pattern in end-of-line production data. At weekly and monthly output calculation, the throughput difference between an automated cell and a comparably-staffed manual team becomes operationally significant.
2. Pallet Quality Controlled by Programming, Not Judgment
Automated palletizers build every pallet to the same pattern specification: layer height, product orientation, weight distribution, and overhang tolerances are controlled by the system on each cycle. Pallet rejection rates at shipping docks – a downstream cost that manual operations generate regularly – drop toward zero.
DNC’s engineers have commissioned palletizing systems across food and beverage, consumer goods, and edible oil facilities in Selangor and Johor. Across those integrations, product damage claims attributable to palletizing inconsistency decrease by 75–80% following automation – consistent with DNC’s documented error reduction baseline across material handling automation projects.
3. Third-Shift Operation on Electricity, Not Overtime
Running a third shift with manual palletizing requires additional workers, shift differentials, and heightened safety risk from fatigue-related errors in off-peak hours. An automated cell runs the third shift on electricity and a maintenance schedule. The incremental cost of adding production hours drops from a per-head labor cost to a per-kWh electricity cost – a structural cost advantage that scales proportionally with production volume.
4. Injury Elimination and Compliance Positioning
Removing workers from repetitive heavy lifting eliminates the MSD exposure category for those tasks. Facilities that automate palletizing record near-zero palletizing-related injury claims within the first year of operation. That record improves standing with industrial insurers, reduces OSHA ergonomic compliance documentation time, and strengthens the facility’s ESG reporting position – increasingly scrutinized by multinational OEM customers requiring supplier compliance certifications.
5. Labor Redeployment to Higher-Value Roles
Automated palletizing does not always reduce headcount immediately. The more common outcome in Malaysian manufacturing is that workers previously assigned to manual palletizing are redeployed to quality inspection, line monitoring, packaging configuration, or maintenance support. This addresses a workforce management challenge directly: retaining experienced production workers who resist physically demanding palletizing assignments while building facility capability for more complex automation-adjacent tasks.

The Labor Cost Equation: Manual vs Automated Over 36 Months
The comparison below reflects cost structure ranges derived from Malaysian manufacturing labor benchmarks and DNC’s automation project base. Ranges are used where costs vary by facility size and volume; point estimates are avoided for volatile data categories.
| Cost Category | Manual Palletizing | Automated Palletizing |
| Direct labor (wages + EPF/SOCSO) | RM 4,500–6,500/month per worker × 4–6 workers per shift | Eliminated for palletizing task |
| Workers’ compensation + insurance | Variable – MSD claims drive 15–30% insurance premium increases over time | Near-zero for palletizing-related claims |
| Training + onboarding (annual) | RM 1,500–3,000 per replacement worker at 20%+ turnover | System operator training: 1–2 workers, commissioning period only |
| Product damage + rework | 1–3% of pallet output → downstream claims and rework costs | Below 0.1% (programmed pattern accuracy) |
| Capital equipment | Minimal (conveyor infeed + pallet jacks) | RM 250,000–600,000+ depending on throughput and integration scope |
| Maintenance | Ad hoc – injury management, turnover, rework | Scheduled preventive maintenance: predictable annual budget |
| 36-month cost trajectory | Escalating – wage growth + compounding MSD exposure | Front-loaded CAPEX → declining per-unit cost from month 1 |
The payback window for automated palletizing in mid-volume Malaysian manufacturing – based on DNC’s integration work across 1,000+ automation projects – falls in the 2–4 year range at current labor cost levels. For facilities evaluating this as part of a broader warehouse automation strategy, palletizing is typically the first end-of-line system to justify CAPEX. Facilities that qualify for NIMP 2030 capital investment support can compress that payback window further: automation capex approved under MIDA’s Industry 4.0 grant framework qualifies for specific tax incentive categories that reduce net investment cost in the first year.
4 Production Readiness Signals for Palletizing Automation ROI
The volume question – “are we large enough to automate?” – is the wrong frame. Four production signals determine whether automation delivers ROI faster than continued manual operation:
Signal 1: Volume Consistency, Not Peak Volume
Automated palletizing ROI depends on utilization rate, not peak capacity. A facility running 150+ cases per hour for at least six hours per production shift across five or more days per week has a utilization profile that justifies a robotic cell. Facilities with intermittent peaks and long idle periods between runs do not.
Signal 2: Workforce Turnover Above 20% Annually
When palletizing positions turn over more than 20% of the workforce each year, training and onboarding costs become a recurring drag. That pattern indicates the role is unsustainable at current labor market conditions – and that the facility is one recruitment failure away from a throughput disruption.
Signal 3: Product Damage Claims Traceable to Palletizing
If your facility receives carrier or customer claims where the root cause traces to pallet instability – overhanging layers, inconsistent height, load distribution failures – the quality cost of manual palletizing has already exceeded acceptable levels. This is a direct ROI acceleration signal.
Signal 4: SKU Portfolio Stabilization
Robotic palletizing performs best with a defined, stable product range – consistent case dimensions, predictable weight profiles, repeatable patterns. Facilities that have stabilized their primary SKU portfolio but still run manual palletizing are operating below the efficiency potential of their existing production line.

Palletizing Automation Options for Malaysian Manufacturers
Three automation configurations address different throughput profiles, floor space constraints, and capital budgets:
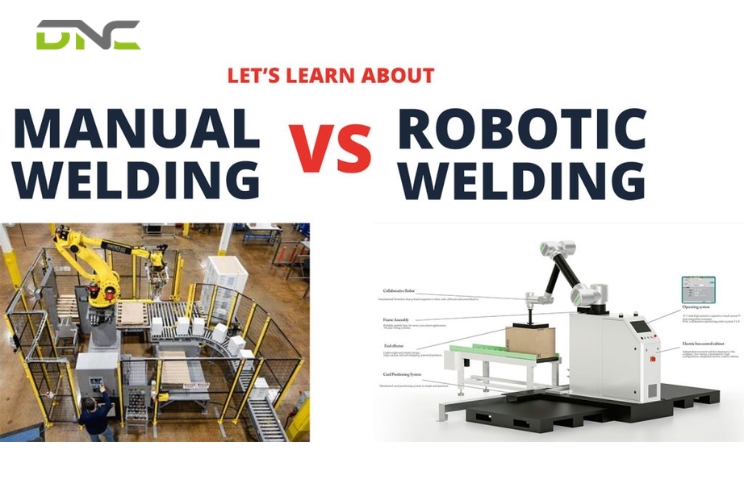
Robotic Arm Palletizers – High-Volume Multi-Line Operations
Six-axis articulated robot palletizers handle 10–60 cycles per minute (up to 3,600 cycles per hour), support mixed SKU stacking through vision-guided picking, and integrate with multi-line infeed conveyors in high-volume food and beverage, consumer goods, and chemical production environments. DNC supplies and commissions these systems as part of a turnkey robotic solutions package that includes cell design, safety fencing, PLC programming, and operator training. These systems require dedicated safety fencing, PLC integration, and four to eight weeks of commissioning time. Best fit: facilities running 200+ cases per hour (approximately 4,800+ cases per 24-hour shift) with consistent product formats targeting continuous operation.
For facilities where floor space is constrained or the SKU portfolio is mixed, a cobot configuration delivers automation benefits without the footprint and integration demands of a full industrial cell.
Cobot Palletizers – Mid-Sized Facilities with Mixed SKU Profiles
Collaborative robot palletizers (cobots) operate alongside workers without safety barriers, use a smaller footprint than industrial robotic cells, and accept new product format programs without specialist programming knowledge. Cobots handle lighter loads and lower throughput than industrial robots, but deploy on existing floor space without facility reconfiguration. Best fit: facilities at 80–150 cases per hour (approximately 1,200–2,400 cases per 8-hour shift) with multi-SKU product mix and limited floor space.
Where throughput is the primary constraint – and product format is fixed – a conventional layer palletizer achieves speeds neither robotic arm nor cobot configurations can match.
Conventional Layer Palletizers – Single-Format, High-Speed Lines
Layer palletizing systems – gantry or infeed conveyor configurations – achieve the highest throughput rates for standardized, single-format products. These are the configurations deployed in high-speed beverage, edible oil, and FMCG lines where product dimensions are fixed and throughput is the primary optimization target. Best fit: single-SKU or narrow-format production with consistent throughput demand.
The Transition Process: Manual to Automated Palletizing in 5 Steps
The transition from manual to automated palletizing follows a structured engineering process. Skipping steps adds cost and delays ROI realization.
Step 1 – Production Line Assessment
Document current palletizing throughput (cases per hour per station), product specifications (case dimensions, weight, fragility), pallet patterns in use, and infeed conveyor configuration. This data package is the input for system selection. Without it, system vendors specify on assumptions.
Step 2 – System Selection and ROI Modeling
Match throughput requirements, product profile, and floor space to the correct system type. Build a 36-month cost model comparing current manual cost trajectory against automation CAPEX plus operating costs. Include a NIMP 2030 grant eligibility assessment in the model – this step changes the payback calculation for qualifying facilities.
Step 3 – Integration Engineering
Automated palletizing does not operate in isolation. Integration with upstream conveyor system, pallet dispensers, stretch wrap stations, and warehouse management systems (WMS) must be engineered before installation begins. DNC’s palletizing integrations include SCADA connectivity so that cycle count data feeds directly into production monitoring infrastructure – giving facility managers real-time visibility into end-of-line throughput.
Step 4 – Commissioning and Operator Training
Commissioning a standard robotic palletizing cell takes four to eight weeks. Operator training – covering daily inspection routines, minor fault recovery, and program change procedures – requires two to three operators per cell with three to five days of structured training. The goal is an operations team that manages routine adjustments without engineer support.
Step 5 – 90-Day Performance Baseline
The first 90 days post-commissioning establish the performance baseline. Cycle counts, downtime events, and pallet quality rejection rates from this period confirm ROI model assumptions and identify any integration adjustments before the system enters standard production rotation.

When Manual Palletizing Remains the Right Answer
Automated palletizing is not the correct specification for every operation. Three conditions keep manual palletizing as the appropriate choice:
Low, irregular production volume: Facilities producing fewer than 80 cases per hour across intermittent runs – seasonal production, prototype builds, small-batch custom orders – don’t generate sufficient utilization to justify automation CAPEX. The payback period extends past five years at that volume.
Extreme product variability: Operations handling highly irregular product shapes, fragile items requiring individual handling judgment, or a very high and constantly changing SKU count cannot be fully automated without custom EOAT investment that resets the ROI calculation.
Pre-automation capital stage: Smaller manufacturers with annual production output that places them below the threshold where 36-month cost modeling shows automation payback within four years are better served by manual palletizing with proper ergonomic controls as an interim position – with automation revisited as volume scales.
The key question in all three cases: does the cost trajectory of manual palletizing, projected 36 months forward, exceed the CAPEX-plus-operating-cost of automation at current and projected volume? For most Malaysian manufacturers operating above the thresholds outlined above, the answer is yes. Delay carries a real monthly cost.
Frequently Asked Questions
What is the ROI payback period for automated palletizing in Malaysian manufacturing?
For mid-volume Malaysian manufacturing operations, the payback period for automated palletizing falls in the 2–4 year range at current labor cost levels. Facilities that qualify for NIMP 2030 capital investment incentives through MIDA’s Industry 4.0 grant framework can reduce the net investment cost and shorten that payback window in the first year.
What production volume justifies switching from manual to automated palletizing?
A facility running 150+ cases per hour consistently across six or more hours per shift, five days per week, has a utilization profile that typically justifies a robotic palletizing cell. Below 80 cases per hour with intermittent production runs, manual palletizing remains the more cost-effective answer. The 80–150 cases per hour range is the evaluation zone where a cobot palletizer often delivers faster payback than a full robotic installation.
What are the hidden costs of manual palletizing that most cost models miss?
The most underestimated costs in manual palletizing are: workers’ compensation claims and insurance premium increases driven by MSD injury rates; training and onboarding cycles at high-turnover palletizing roles (three to six weeks per replacement worker); supervision overhead at any operation running four or more workers per shift; and product damage claims generated by inconsistent pallet quality reaching destination facilities.
Can automated palletizing handle multiple SKUs or irregular product shapes?
Yes, within defined ranges. Robotic arm palletizers equipped with vision-guided picking and interchangeable end-of-arm tooling (EOAT) handle mixed SKU palletizing effectively for products within a specified dimension and weight range. Cobot palletizers manage similar mixed-format tasks at lower throughput. Highly irregular shapes, fragile items requiring individual handling judgment, or very high SKU counts with constantly changing case formats require custom EOAT investment that affects the ROI calculation.
What is the first step for a Malaysian manufacturer evaluating palletizing automation?
The first step is a production line assessment: document current palletizing throughput in cases per hour, product specifications (case dimensions and weight), pallet patterns in use, and infeed conveyor configuration. This data package is the input for system selection and 36-month cost modeling. DNC’s engineers conduct this assessment as part of the free consultation process – the output is a system recommendation with ROI model specific to your facility’s volume profile and floor layout.
- 9 views
- 0 Comment
Recent Comments