


Warehouse Storage Capacity Calculation | DNC Automation Malaysia
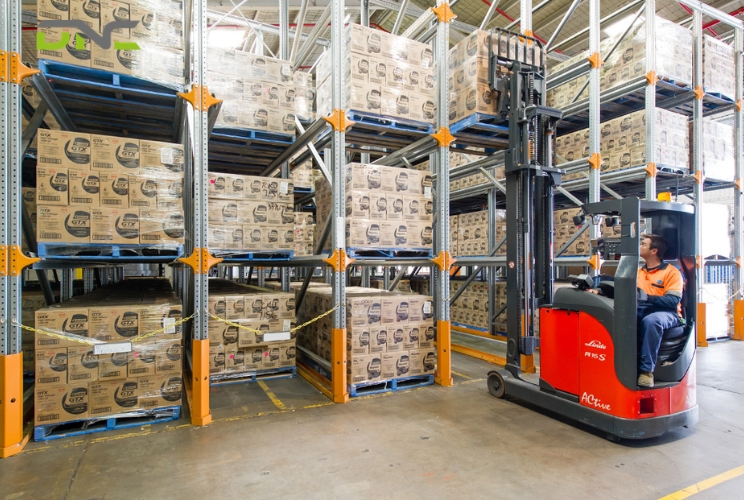
Warehouse storage capacity calculation determines the precise storage volume your facility holds – and whether your current racking layout is extracting full value from every square metre of floor space.
For Malaysian manufacturers navigating rising labour costs and NIMP 2030 Industry 4.0 targets, warehouse storage capacity calculation is the starting baseline for every warehouse investment decision: from pallet racking upgrades to automated storage and retrieval system (AS/RS) implementation.
This guide covers five interconnected formulas – gross-to-net floor area, usable cubic capacity, pallet positions per racking bay, warehouse cube utilization rate, and storage density per square metre – with worked examples in metric units calibrated to Malaysian pallet standards (1,200 × 1,000 mm).
Each formula builds on the previous, producing a complete capacity profile that maps the performance gap your racking or automation investment is designed to close.
————————————————————
Warehouse Storage Capacity Defined: Theoretical vs Working Capacity
A common misconception equates warehouse capacity with floor area – as if a 5,000 m² facility automatically stores 5,000 m² worth of goods. Clear height, racking type, and non-storage zone allocation determine actual capacity far more than floor area alone.
In a warehouse context, storage capacity is the maximum volume of goods your facility holds under its current racking and layout configuration – not the floor area stated on a property lease. Two facilities with identical gross floor areas can differ by 40% or more in actual usable capacity, depending on racking type, aisle configuration, and clear height utilisation.
Two distinct metrics define warehouse storage capacity in practice. Theoretical storage capacity is the total cubic volume enclosed by the building’s four walls and roof, calculated purely from structural dimensions. Working storage capacity – the figure that governs real operations – subtracts non-storage zones: loading docks, staging lanes, offices, forklift charging bays, and fire safety clearances.
The distinction matters because most capacity shortfalls are working capacity problems, not structural ones.
A facility reporting 70% utilisation based on theoretical capacity may be running at over 90% of its working capacity – which explains picking congestion, aisle blockages, and safety incidents that floor managers experience long before a structural expansion is warranted.
For Malaysian manufacturing facilities, non-storage zones typically account for 20–35% of total gross floor area, depending on whether receiving, staging, and quality inspection are integrated into the warehouse floor plan or separated into dedicated rooms.
The calculation steps in the following section convert gross floor area into working storage capacity – the correct input for every formula in this guide.
→ Warehouse Automation – ASRS & WMS Integration covers how working capacity limits determine automation feasibility thresholds.
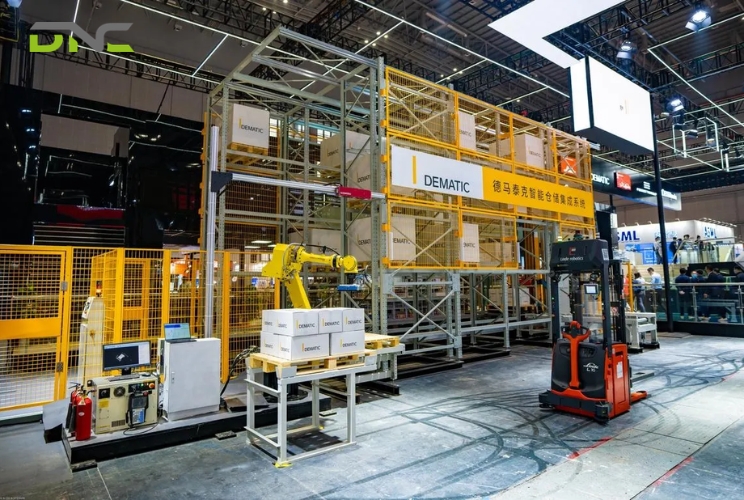
Warehouse Storage Capacity
Warehouse Storage Capacity Calculation: The Five-Step Formula
Warehouse storage capacity is calculated in five steps: measure gross floor area, subtract non-storage zones, apply clear height, and compare occupied volume against total capacity to produce a utilisation percentage. All five steps use metric units – the standard for Malaysian and ISO-aligned manufacturing environments.
The Five-Step Calculation
The following steps produce both cubic capacity (m³) and a utilisation rate (%).
Step 1 – Measure total gross floor area (m²)
Measure the internal floor area of your warehouse, wall to wall.
Total Floor Area = Internal Length (m) × Internal Width (m)
Step 2 – Calculate non-storage area (m²)
Identify every zone that cannot hold racked inventory: loading dock aprons, offices, restrooms, staging lanes, forklift charging stations, and fire hose reel clearances.
Non-Storage Area = Sum of all non-storage zones (m²)
Step 3 – Derive usable storage area (m²)
Usable Storage Area = Total Floor Area – Non-Storage Area
For a 5,000 m² (53,820 sq ft) facility with 1,250 m² of non-storage zones, usable storage area is 3,750 m² (40,365 sq ft).
Step 4 – Determine clear height (m / ft)
Clear height is the vertical distance from the finished floor to the lowest permanent overhead obstruction – typically a lighting fixture, sprinkler head, or structural beam. Clear height sets the absolute ceiling on vertical storage capacity. A facility with 8 m (800 cm / 26.2 ft) of clear height stores 33% more volume per square metre than one with 6 m (600 cm / 19.7 ft) in the same footprint.
Step 5 – Calculate storage capacity and utilisation rate
Storage Capacity (m³) = Usable Storage Area (m²) × Clear Height (m)
Utilisation Rate (%) = (Volume Currently Occupied ÷ Storage Capacity) × 100
The worked example below applies all five steps to a standard Malaysian manufacturing facility.
Worked Example – Malaysian Factory, 5,000 m² Facility
The table below lists the four inputs in the order they are collected – gross floor area, the non-storage deduction, the usable area that results, and clear height – followed by the storage capacity they produce.
| Input | Value |
| Total gross floor area | 5,000 m² (53,820 sq ft) |
| Non-storage area (offices, docks, staging) | 1,250 m² (25%) |
| Usable storage area | 3,750 m² (40,365 sq ft) |
| Clear height | 8 m (26.2 ft) |
| **Storage capacity** | **30,000 m³ (1,059,440 cu ft)** |
If this facility currently occupies 21,000 m³ of that volume:
Utilisation Rate = (21,000 ÷ 30,000) × 100 = 70%
A rate of 70% sits at the lower boundary of the efficient operating range. This facility holds 9,000 m³ of theoretical headroom yet may still experience picking congestion – because usable working capacity is constrained by racking layout, not cubic volume alone.
Pallet positions – the next formula – convert cubic capacity into the operational unit that matters for day-to-day warehouse management.
————————————————————
Pallet Positions Calculation: Converting Floor Area to Storage Units
Pallet positions in a warehouse are determined by rack bay footprint, number of beam levels, and the aisle-to-storage area ratio – not by total floor area alone. A facility allocating 60% of its usable storage area to racking and 40% to access aisles produces a fundamentally different pallet count than one running narrow-aisle racking at 70% storage allocation.
Malaysian Pallet Standard
Malaysian warehousing operations predominantly use 1,200 × 1,000 mm pallets (ISO Series 1 standard), not the North American GMA pallet (1,219 × 1,016 mm). Rack bay specifications – beam length, upright frame depth, and beam level spacing – are designed around the pallet footprint. Using GMA-sized inputs for a Malaysian ISO-pallet facility produces systematic underestimates of positions per bay. The formula below uses ISO 1,200 × 1,000 mm dimensions throughout.
Pallet Positions Formula
The formula requires four inputs: usable area allocated to racking, single rack bay footprint, number of beam levels, and pallets per beam level.
Pallet Positions = (Racking Area ÷ Rack Bay Footprint) × Levels × Pallets per Level
Typical values for standard selective racking with a reach truck and ISO pallets are listed in the table below.
| Parameter | Typical Value |
| Rack bay width | 2,700 mm / 2.7 m (holds 2× 1,200 mm pallets + clearance) |
| Rack bay depth | 1,100 mm / 1.1 m (1,000 mm pallet + 100 mm clearance) |
| Rack bay footprint | 2.97 m² (31.9 sq ft) |
| Aisle width (reach truck) | 2,800 mm / 2.8 m (9.2 ft) |
| Effective bay footprint (inc. proportional aisle share) | ~4.5 m² |
| Beam levels | 4 (floor level + 3 racked levels) |
| Pallets per level | 2 |
| Positions per bay | **8** |
Applying these inputs to the 3,750 m² usable storage area from the earlier example shows how pallet positions scale with racking allocation.
Worked Example – 3,750 m² Usable Storage Area
Assuming 60% racking allocation (2,250 m²) and 40% aisles and staging:
Rack bays = 2,250 m² ÷ 4.5 m² = 500 bays
Pallet Positions = 500 × 4 levels × 2 pallets = 4,000 pallet positions
Switching to narrow-aisle racking (effective bay footprint ~3.2 m²) in the same area:
Rack bays = 2,250 ÷ 3.2 = 703 bays → 5,625 pallet positions
The result: a 40% increase in pallet positions with no change to building footprint and no increase in racking height. The cube utilization rate, covered next, determines whether those 4,000–5,000+ positions are being used efficiently or whether honeycombing and poor slotting are eroding the capacity already installed.
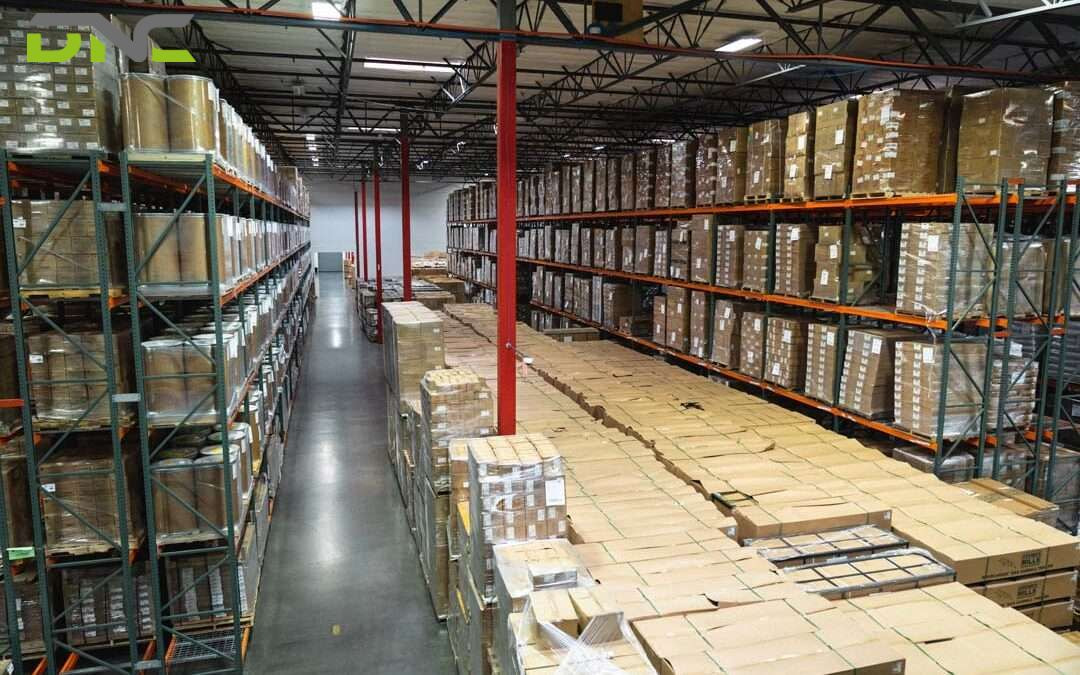
Converting Floor Area to Storage Units
Warehouse Cube Utilization: Formula, Benchmarks, and Industry Targets
Warehouse cube utilization measures what percentage of your total warehouse volume is actively occupied by inventory – and an optimally operated facility runs between 70% and 85%, not at 100%. A warehouse at 100% cube utilization cannot process orders efficiently: order pickers cannot manoeuvre, FIFO rotation becomes impractical, and any inbound surge creates immediate congestion.
The Cube Utilization Formula
Cube Utilization (%) = (Total Inventory Volume ÷ Total Warehouse Volume) × 100
The two inputs are defined as follows.
- Total Inventory Volume = sum of (L × W × H × quantity) for every SKU and pallet currently in storage
- Total Warehouse Volume = Usable Storage Area × Clear Height
A practical shortcut for pallet-based operations: estimate inventory volume as total occupied pallet positions × average pallet volume. Per-pallet average cube utilization over a product lifecycle is typically 70–75%, per Maveneer’s warehouse space utilization research (2025) – meaning a standard 1,200 × 1,000 × 1,500 mm loaded pallet occupies approximately 1.3 m³ of effective inventory volume. The correct utilisation target, however, varies significantly by industry – the formula output must be interpreted against sector-specific benchmarks.
Industry-Specific Target Ranges
Target utilization is not uniform across all Malaysian manufacturing sectors. Inventory characteristics, FIFO requirements, and seasonal demand patterns shift the optimal operating range for each industry vertical.
| Industry / Inventory Type | Target Cube Utilization | Rationale |
| General industrial parts (non-expiring) | 75–85% | Low FIFO pressure; uniform pallet profiles enable tight stacking |
| Food and beverage (short shelf life, FIFO) | 55–70% | FIFO rotation requires accessible front positions; honeycombing is structurally unavoidable |
| Consumer goods / FMCG | 65–75% | Seasonal demand surges require retained buffer capacity |
| Automotive components (JIT delivery) | 60–70% | Delivery window precision and sequencing requirements override density targets |
| Pharmaceutical / healthcare (GDP compliance) | 50–65% | Quarantine zones, temperature segregation, and recall-access aisles reduce effective utilization |
A Malaysian food manufacturer targeting 85% cube utilization in a FIFO pallet flow racking system will face product rotation failures within weeks. The correct target for that operation is 60–65% – with the remaining capacity held for FIFO lane cycling and inbound buffer.
The storage density formula, covered next, translates these utilization percentages into a comparative metric that can be benchmarked across different racking configurations and facilities of different sizes.
————————————————————
Storage Density Formula: Measuring How Hard Your Racking Works
Storage density quantifies how many pallet positions your facility holds per square metre of floor space – making it the only metric that enables direct comparison between facilities of different sizes and racking types. Cube utilization tells you how full your warehouse is; storage density tells you whether the racking configuration is the right tool for the load it carries.
The Storage Density Formula
Storage Density (positions per m²) = Total Pallet Positions ÷ Total Floor Area
Or, in cubic terms:
Storage Density (m³/m²) = Total Inventory Volume (m³) ÷ Total Floor Area (m²)
For a facility with 4,000 pallet positions and a 5,000 m² total floor area:
Storage Density = 4,000 ÷ 5,000 = 0.80 pallet positions per m² (0.074 positions per sq ft)
At 0.80 positions per m², this facility operates within the selective racking range – the benchmarks below show how that figure compares across racking systems and where the automation threshold sits.
Density Benchmarks by Racking System
The racking system is the primary lever on storage density. The following table shows density multipliers relative to ground-level floor stacking – the baseline configuration most Malaysian factories began with before racking was installed.
| Racking System | Density vs Floor Stack | Pallet Positions per m² | Application |
| Floor stacking (reference baseline) | 1× | 0.25–0.35 | Very low SKU count, high pallet uniformity |
| Selective pallet racking (3–4 levels) | 3–4× | 0.75–1.10 | Standard multi-SKU warehouse |
| Double-deep racking (4 levels) | 4–5× | 1.00–1.40 | Low SKU variety, LIFO acceptable |
| Drive-in / drive-through racking | 5–7× | 1.40–1.80 | Single-SKU or very-low-variety bulk storage |
| VNA (Very Narrow Aisle) racking | 5–8× | 1.50–2.00 | High-value floor space; turret truck required |
| AS/RS (Automated Storage & Retrieval) | **8–16×** | 2.00–4.00+ | Maximum density; full automation |
AS/RS systems deliver 2–4× more storage in the same footprint as conventional pallet racking – consistent with DNC Automation’s validated engineering range across installed projects in Malaysia.
Storage density above 1.50 positions per m² using conventional racking requires narrow-aisle equipment and specific aisle-width trade-offs. The racking capacity sizing section below covers how to calculate available positions for selective, double-deep, and high-density configurations within a defined floor envelope.

Measuring How Hard Your Racking Works
Racking Capacity Calculator: Sizing Selective, Double-Deep, and High-Density Systems
Racking capacity depends on three independent constraints: bay configuration (positions per bay), structural load rating (kg per beam level), and aisle requirement (m² of floor consumed by access) – the binding constraint determines actual operational capacity, not the theoretical maximum. Oversizing beam levels relative to load rating wastes capital; undersizing creates overloading risk. The correct calculation balances all three.
Selective Pallet Racking Capacity
Selective racking provides 100% access to every pallet position – each position is individually reachable without relocating another pallet. It is the most common configuration in Malaysian manufacturing warehouses.
Positions per bay = Levels × Pallets per Level
For a standard ISO-pallet selective bay (2,700 mm wide, 4 levels, 2 pallets per level):
Positions per bay = 4 × 2 = 8 positions
Load rating check: beam capacity must exceed the combined weight of all pallets on that beam level. Standard beam levels for ISO pallets at 1,000 kg per pallet carry a combined 2,000 kg per beam. Specify upright frames and beams rated to at least 2,200 kg per beam level – a 10% safety margin per BS EN 15512. When higher density is required in the same footprint, double-deep racking doubles positions per aisle at the cost of full SKU selectivity.
Double-Deep Racking Capacity
Double-deep racking places two rack rows back-to-back, doubling pallet depth per aisle and requiring a deep-reach forklift. The density increase is approximately 40% versus selective racking in the same floor area – fewer aisles serve the same number of bays.
Positions per bay = Levels × Pallets per Level × 2 (depth)
For a 4-level double-deep bay: 4 × 2 × 2 = 16 positions – double a selective bay in the same 2,700 mm bay width.
The trade-off: last-in, first-out (LIFO) stock rotation only. Double-deep is unsuitable for food, pharmaceutical, or any FIFO-managed inventory. For operations where LIFO is acceptable but even higher density is required, drive-in racking and VNA racking are the next escalation levels.
High-Density Systems: Drive-In Racking and VNA Racking
The following systems apply where either density or aisle efficiency is the binding operational constraint.
Drive-in racking eliminates cross-aisles entirely only when the storage layout is designed for single-SKU or very-low-variety lanes – under conditions where forklift access from one end per lane is the operational model. Density increases of 5–7× over floor stacking are achievable, but SKU selectivity drops to near zero – drive-in is suitable only for single-SKU or very-low-variety bulk storage.
VNA racking reduces aisle widths to 1,500 mm (1.5 m / 4.9 ft) only when the forklift fleet is replaced with turret trucks or rail-guided order pickers rated for that aisle envelope. The same usable storage area that holds 500 selective bays can hold 700–800 VNA bays – a 40–60% capacity increase with no change to building footprint or racking height.
The interpretation benchmarks in the following section map these density outputs to operating zone classifications and determine whether a racking upgrade closes the identified capacity gap – or whether the calculation points to automation.
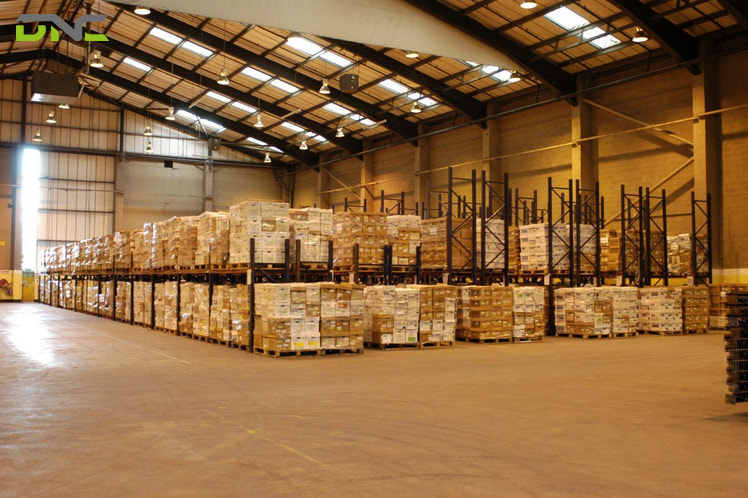
High-Density Systems: Drive-In Racking and VNA Racking
————————————————————
Interpreting Your Results: Benchmarks, Red Flags, and the 85% Ceiling
Warehouse storage capacity calculation produces a utilisation percentage – and that percentage places your facility in one of three operational zones, each with a distinct set of required actions. The 85% ceiling is not an arbitrary guideline: it is the threshold above which four specific operational failures become statistically unavoidable in pallet-based warehouse environments.
The Three Operating Zones
Each zone below pairs a utilisation range with the operational signal it produces and the action that follows, so a calculated percentage maps directly to a decision rather than to a judgement call.
| Utilisation Zone | Range | Operational Signal | Recommended Action |
| Underutilised | < 60% | Fixed costs not amortised across sufficient throughput | Consolidate SKUs, review inbound frequency, evaluate subletting |
| Efficient operating range | 60–85% | Picking unobstructed; FIFO feasible; seasonal buffer intact | Maintain; run quarterly recalculation to detect creep |
| Congestion zone | > 85% | Honeycombing, picking errors, safety violations, inbound backlogs | Racking upgrade, layout redesign, or automation assessment required |
The congestion zone is not a marginal risk – operating above 85% triggers four specific, compounding failures.
The Four Consequences Above 85%
Operating consistently above 85% storage utilisation produces four predictable operational failures in Malaysian manufacturing warehouses.
Honeycombing emerges first – partially empty pallet positions that cannot be consolidated because surrounding positions are inaccessible. Honeycombing wastes 8–15% of apparent capacity in high-utilisation conventional racking (per leanmh.com warehouse management research, 2024).
Elevated picking error rate follows in operations where aisle congestion forces pickers to deviate from standard pick routes. In congested warehouse environments, error rates increase as pickers take positional shortcuts to compensate for reduced manoeuvrability.
Safety incident exposure increases in facilities where forklifts and reach trucks operate in aisles where inventory encroaches on clearance margins required by DOSH (Department of Occupational Safety and Health Malaysia).
In warehouses where aisle clearance drops below the DOSH-specified minimums, marginal violations generate reportable near-miss incidents that trigger mandatory investigation.
Zero seasonal buffer is the fourth consequence. A facility at 88% utilisation in Q2 reaches 100% during Q3 peak demand – inbound goods cannot be received without first clearing existing stock, creating supply chain bottlenecks that resolve only through expensive external storage at spot market rates.
When the calculation places your facility in the congestion zone, the question shifts from optimisation to investment: which intervention level permanently closes the gap – racking reconfiguration, high-density racking installation, or AS/RS automation.
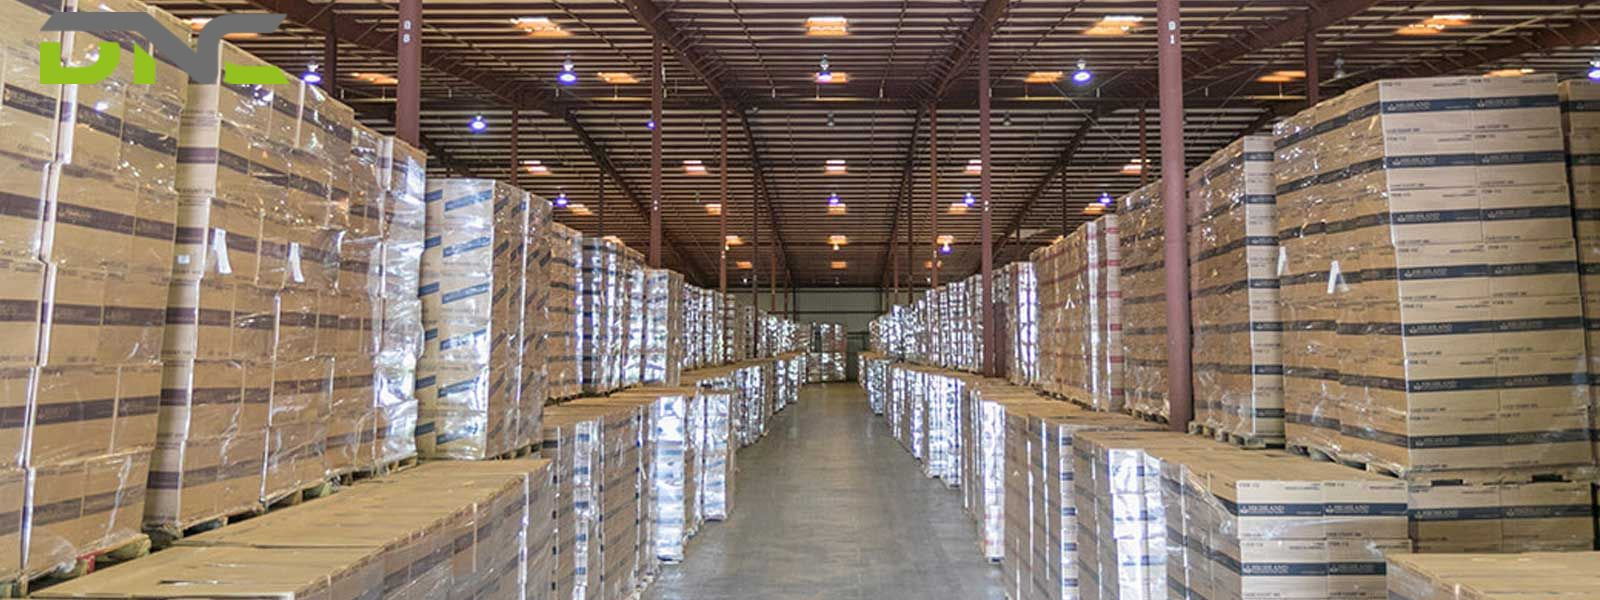
Warehouse storage capacity calculation produces a utilisation percentage
Capacity Gap Analysis: The Three-Level Automation Decision Framework
Capacity gap analysis for Malaysian manufacturers converts calculation outputs into a capital allocation decision between three escalating intervention levels: racking reconfiguration, high-density racking installation, and AS/RS automation. Each level closes a different magnitude of gap and delivers a different ROI profile under NIMP 2030 investment frameworks.
The Three-Level Decision Framework
The table below maps calculation outputs to intervention levels based on the size of the identified capacity gap.
| Calculation Output | Gap Identified | Intervention Level | Expected Outcome |
| Utilisation 60–85%, density < 0.80 positions/m² | Layout inefficiency, not structural | Level 1: Racking reconfiguration + slotting optimisation | Recover 15–25% capacity; minimal capital expenditure |
| Utilisation > 85%, density 0.80–1.40 positions/m² | Racking system limitation | Level 2: High-density racking (double-deep, VNA, or drive-in) | Increase pallet positions 40–100% in same footprint |
| Utilisation > 85%, density > 1.40 positions/m², building cannot expand | Structural ceiling reached | Level 3: AS/RS integration | 2–4× storage density; 40–50% throughput increase |
Level 3 is indicated only when three specific calculation outputs appear together – the following thresholds define that trigger point.
Automation Threshold Indicators
Three outputs from the capacity calculation – taken together – indicate when AS/RS becomes the correct engineering response rather than a racking upgrade.
First: storage density exceeds 1.40 pallet positions per m² using conventional racking – the facility is already at the practical maximum for forklift-accessed configurations without VNA equipment.
Second: cube utilisation remains consistently above 85% for more than two consecutive quarters, with seasonal peaks exceeding 95%.
Third: pallet positions calculation shows fewer than 15% additional positions achievable through any racking reconfiguration within the existing building envelope.
When all three indicators are present, AS/RS integration – delivering 2–4× the storage density of conventional racking in the same footprint – produces payback periods of 2–4 years for mid-to-large Malaysian manufacturers, per DNC Automation’s validated project data across 1,000+ installations. Malaysian manufacturers pursuing NIMP 2030 targets often position AS/RS as the warehouse component of a broader Smart Manufacturing & Industry 4.0 programme.
For facilities that have not yet reached these thresholds, the correct entry point is a structured racking audit that maps current pallet positions against capacity calculation outputs, identifies honeycombing losses, and specifies the minimum-cost racking configuration that restores the 60–85% efficient operating zone.
DNC Automation’s engineering team sizes warehouse storage systems – from selective racking through AS/RS integration – based on calculation outputs, not product catalogues. Your facility’s capacity profile is the starting point: get a free consultation from our engineers to map the right intervention level for your operation.
————————————————————
Mid-Summary: Five Formulas, One Capacity Profile
The five formulas above produce a complete warehouse capacity profile from a single set of floor measurements, summarised below.
| Formula | Output | Primary Use |
| Gross → Net Floor Area | Usable storage area (m²) | Baseline input for all subsequent formulas |
| Cubic Capacity | Total storage volume (m³) | Utilisation rate denominator |
| Pallet Positions | Total pallet positions | Operational storage unit |
| Cube Utilization Rate | % of volume occupied | Operating zone classification |
| Storage Density | Positions per m² | Racking system comparison; automation threshold |
Run these calculations quarterly. Capacity creep – utilisation drifting upward by 2–3% per quarter as stock accumulates without corresponding layout adjustments – is undetectable without periodic recalculation. It is the most common root cause of unplanned warehouse expansion projects in Malaysian manufacturing operations.
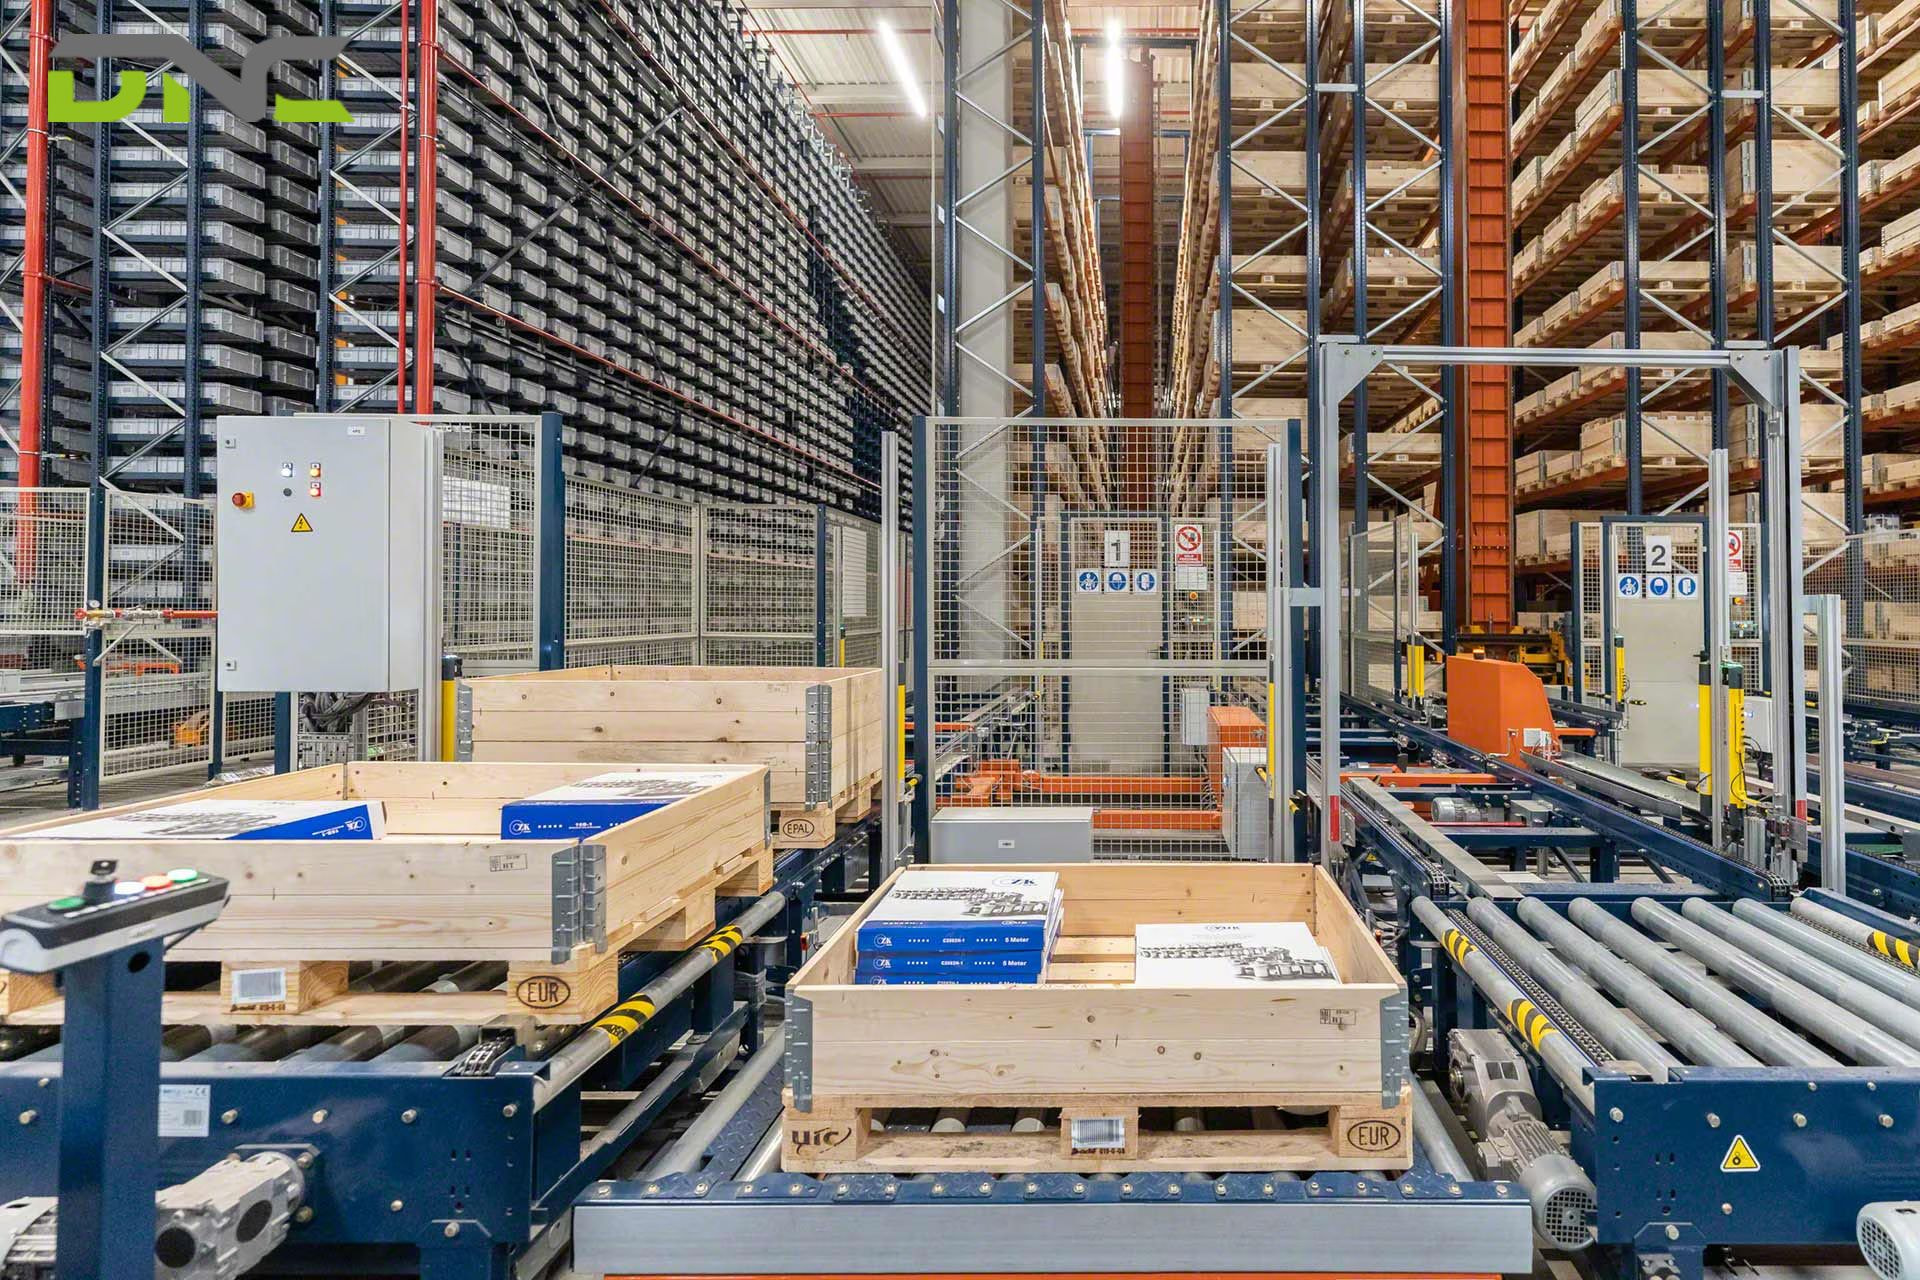
Benefits of Choosing DNC Automation for Your Warehouse
FAQ: Warehouse Storage Capacity Calculation
The following questions cover the most common calculation points for Malaysian manufacturing operations. Each answer assumes the cubic and pallet-position methods set out above, and states which of the two applies before giving a figure.
What Is the Formula for Warehouse Storage Capacity?
Storage Capacity (m³) = Usable Storage Area (m²) × Clear Height (m). Usable storage area equals total gross floor area minus non-storage zones – loading docks, offices, staging lanes, and safety clearances. For utilisation rate: divide current occupied volume by storage capacity and multiply by 100. Target utilisation is 60–85% for most Malaysian manufacturing operations.
How Do I Calculate Pallet Positions in a Warehouse?
Total Pallet Positions = (Racking Area ÷ Rack Bay Footprint) × Beam Levels × Pallets per Level. For Malaysian facilities using ISO 1,200 × 1,000 mm pallets, a standard selective bay (2,700 mm wide, 4 levels, 2 pallets per level) holds 8 positions. Effective bay footprint includes the proportional aisle share – approximately 4.5 m² per bay with a reach truck aisle of 2,800 mm.
What Is a Good Warehouse Cube Utilization Rate?
Cube utilization’s efficient operating range is 60–85% for most warehouse types. The appropriate target varies by inventory: 75–85% for general industrial parts, 55–70% for FIFO food and beverage operations, and 50–65% for pharmaceutical facilities with quarantine and recall-access zone requirements. Rates above 85% consistently produce honeycombing, picking congestion, and DOSH safety clearance violations.
What Is the Difference Between Gross and Usable Storage Capacity?
Gross storage capacity is the theoretical maximum cubic volume of the entire building – useful for structural assessments only. Usable storage capacity subtracts all non-storage zones and is the correct input for utilisation rate, pallet position, and storage density calculations. For Malaysian manufacturing facilities, non-storage zones typically represent 20–35% of total gross floor area.
How Does Racking System Choice Affect Warehouse Storage Density?
Selective pallet racking achieves 0.75–1.10 pallet positions per m² at 3–4 beam levels. Double-deep racking reaches 1.00–1.40 positions per m² – approximately 40% denser in the same footprint. VNA racking operates at 1.50–2.00 positions per m². AS/RS integration delivers 2–4× the pallet density of conventional racking in the same building, validated across DNC Automation’s installed base of warehouse projects in Malaysia.
When Should a Malaysian Manufacturer Consider Warehouse Automation?
Three concurrent indicators suggest AS/RS automation is the correct intervention: storage density exceeds 1.40 pallet positions per m² under conventional racking, cube utilisation remains above 85% for two or more consecutive quarters, and racking reconfiguration recovers fewer than 15% additional positions within the existing building envelope. Facilities meeting all three criteria typically achieve AS/RS payback within 2–4 years under current NIMP 2030 investment incentive frameworks.
Is 85% Warehouse Utilisation Too High for Malaysian Manufacturing Operations?
Yes – 85% is the operational ceiling for most Malaysian manufacturing warehouses, not a performance target. Above 85%, four predictable failures compound: honeycombing erodes apparent capacity by 8–15%, picking error rates rise as aisle congestion forces pickers off standard routes, DOSH safety clearance violations become statistically likely, and zero seasonal buffer remains for Q3–Q4 demand peaks. A facility consistently operating above 85% requires racking reconfiguration or an AS/RS capacity assessment – it is a capacity emergency signal, not an efficiency milestone.
- 30 views
- 0 Comment
Recent Comments