


OEE Calculation: Formula, Worked Example and Data Sources

OEE calculation multiplies availability, performance and quality to give the share of planned production time that makes good parts at full speed. Availability is run time divided by planned production time, performance compares total count with the ideal cycle time, and quality is good count divided by total count. In a Malaysian packaging plant the inputs come from different points: the shift calendar and the programmable logic controller (PLC) clock for time, a counter at the constraint machine for output, and the checkweigher for good count. DNC Automation specifies those count points on end-of-line packaging and weighing lines, so a 72% OEE traces back to named machines instead of one unowned number.
OEE in manufacturing is the share of planned time that makes good parts at full speed
OEE in manufacturing is the percentage of planned production time that is truly productive. A score of 100% means perfect production: only good parts, made as fast as possible, with no stop time, according to a lean-manufacturing knowledge hub that publishes the standard benchmarks. Seiichi Nakajima coined the metric as part of Total Productive Maintenance (TPM), per one line-monitoring vendor’s guide. The metric suits discrete manufacturing, where every piece or pack counts as one unit, and it has become a core measure of smart manufacturing.
Each of the three OEE factors answers one question about the planned time. Availability asks whether the line was running, performance asks whether it ran at its full rate, and quality asks whether the units were good the first time. The table lists the six big losses under the factor that books each of them, with end-of-line examples.
| Factor | Losses booked | End-of-line example |
| Availability | Breakdowns; setup and adjustments | A strapping head jam that halts the line; a carton-size changeover |
| Performance | Reduced speed; small stops | A conveyor running below its rated speed; a blocked sensor that clears itself |
| Quality | Startup rejects; production rejects | Underweight packs rejected at the checkweigher; rework after a failed seal |
OEE sits in the smart manufacturing layer of a plant, because the figure is only as current as the machine data passed upward. DNC’s reading of the Industry4WRD pillars under NIMP 2030 (the New Industrial Master Plan 2030) treats continuous machine data as the raw material for OEE tracking. The three questions become a number once the formula multiplies them.
The OEE formula multiplies availability, performance and quality
The OEE formula multiplies availability, performance and quality: OEE = Availability × Performance × Quality. Each factor is a ratio between 0 and 100%, so the product never exceeds the weakest factor. The table gives the three formulas with the terms they use.
| Factor | Formula | Reads as |
| Availability | Run Time ÷ Planned Production Time | Share of planned time the process was running |
| Performance | (Ideal Cycle Time × Total Count) ÷ Run Time | Share of run time spent at the fastest possible rate |
| Quality | Good Count ÷ Total Count | Share of units that passed first time, with no rework |

The OEE formula multiplies availability, performance and quality
In the OEE formula, Run Time is Planned Production Time minus Stop Time, and Stop Time covers both unplanned stops such as breakdowns and planned stops such as changeovers. Ideal Cycle Time is the fastest cycle the process achieves in optimal conditions. Multiplying it by Total Count gives Net Run Time, the fastest possible time for the pieces made. Performance also reads as (Total Count ÷ Run Time) ÷ Ideal Run Rate, since a rate is the reciprocal of a cycle time.
Substituting the three ratios into the product cancels every intermediate term. The result is OEE = (Good Count × Ideal Cycle Time) ÷ Planned Production Time, which equals Fully Productive Time divided by Planned Production Time. Both forms return the same figure, and the three-factor form is preferred because it shows which loss moved. Two consecutive weeks show why: availability rose 5.0% while quality fell 4.5%, and the headline OEE improved although most plants would reject that trade, as one OEE hardware vendor’s calculation page demonstrates.
Performance above 100% is an OEE data error. It usually means the Ideal Cycle Time is set too slow. The next section runs both forms on one packaging-line shift.
A packaging-line shift worked through gives 72.2% OEE
A packaging-line shift with 450 planned production minutes (7.5 hours, 27,000 seconds) returns 72.2% OEE. The inputs are assumed figures for illustration, not DNC project data. The table lists them for a constraint machine rated at 100 packs per minute (6,000 per hour, 1.67 per second), which is an ideal cycle time of 0.6 seconds.
| Input | Value |
| Shift length | 480 minutes (8 hours, 28,800 seconds) |
| Breaks | 30 minutes, excluded from planned time |
| Planned production time | 450 minutes |
| Stop time | 60 minutes: changeover 25, filler jam 20, starved by upstream 15 |
| Run time | 390 minutes (6.5 hours, 23,400 seconds) |
| Total count | 33,150 packs |
| Rejects | 663 packs |
| Good count | 32,487 packs |
In the OEE calculation, availability is 390 ÷ 450, which is 86.67%. Performance is (0.6 seconds × 33,150) ÷ (390 minutes × 60 seconds), which is 19,890 ÷ 23,400 or 85.00%. Quality is 32,487 ÷ 33,150, which is 98.00%. The product 0.8667 × 0.8500 × 0.9800 gives 72.19%. The short form agrees: (32,487 × 0.6 seconds) ÷ (450 minutes × 60 seconds) is 19,492.2 ÷ 27,000, again 72.19%.
Converting the OEE losses to minutes shows where the shift went. The 60 stop minutes are an availability loss of 13.3% of planned time. Run time held 331.5 minutes of work at full rate, so slow cycles and small stops cost another 58.5 minutes, or 13.0%. The 663 rejects consumed 6.63 minutes of rated capacity, 1.5%. Fully productive time is 324.87 minutes, and the four lines add up to 450.
In this OEE shift the performance loss is as large as the stop loss, yet quality, the factor most plants watch first, costs the least. Every figure above rests on a clock or a counter, so the next section traces where each one comes from.
Five inputs decide whether the OEE figure can be trusted
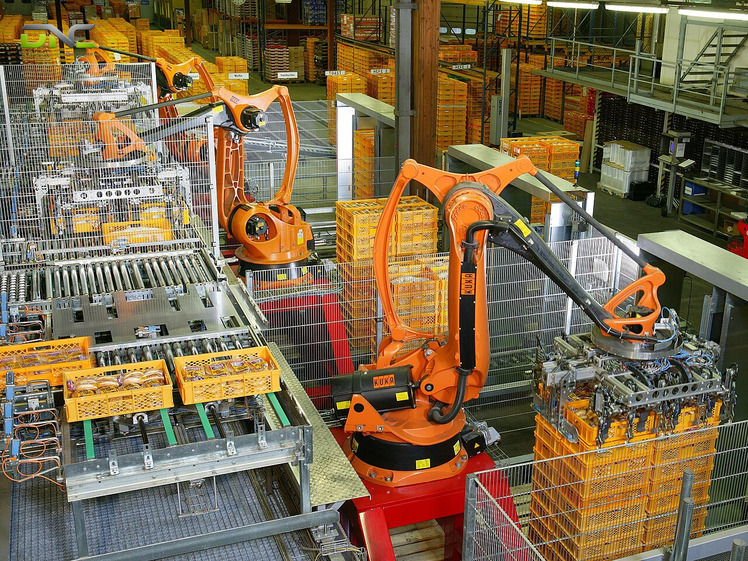
OEE depends on five inputs: planned production time, stop time, total count, ideal cycle time and good count. Time inputs are clocks, output inputs are counters, the cycle time is a chosen rate, and good count is a verdict on each unit. The OEE figure is only as accurate as the weakest of the five, which is DNC’s synthesis of how the formula is built. The table maps each input to its source on an end-of-line packaging line.
| Input | Where it comes from on the line | Typical error |
| Planned production time | Production schedule minus intended non-production time | Breaks counted one way in January and another in March |
| Stop time | PLC machine-state signal plus an operator reason code | Short stops lost below the logging threshold |
| Total count | A counter or sensor at the constraint machine | Counting at a faster non-constraint station |
| Ideal cycle time | Nameplate rate of the constraint, or its fastest demonstrated rate | Rate set too slow, so performance exceeds 100% |
| Good count | Checkweigher accept tally or an inspection-station verdict | Reject tally not mapped back to the machine that caused it |
Machine controls such as a programmable logic controller provide runtime and output automatically, while good units and scrap come from inspection stations or cameras, or from operator entry, according to a data-platform vendor’s OEE guide. The same guide adds that quality is not always detected where the defect arises. On a packaged-goods line that gap is wide. After capping, labelling and cartoning, nobody sees net content by eye, so the verdict becomes a weight verdict taken downstream by a checkweigher system, and that tally has to be debited to the filler that caused the underweight pack.
For OEE, total count and good count therefore come from two different points. When we evaluate a packaging line, the first specification we anchor is the measurand at each station, not the nameplate rate of any single machine. Our line audit fixes the verification point before any station is quoted.
The ideal cycle time is a choice that has to be written down. The maker’s nameplate is the first option when it is available and reliable, the fastest recorded rate from history is the second, and a physical limit is the third, per two OEE guides. A nameplate is a machine rating, not a line output, so the constraint’s rating is the right reference. The five inputs still produce different figures when plants define them differently, which the next section shows on the same shift.
Five inputs decide whether the OEE figure can be trusted
Three conventions change the figure for the same shift
Three calculation conventions change the OEE figure for the same shift: the stop-length threshold, the treatment of breaks and the treatment of planned downtime. Published guides disagree on each, and no guide declares one of them wrong. The table sets the variants side by side.
| Convention | Variants in published guides | Effect on the figure |
| Stop-length threshold | Stops of several minutes or longer; stops of one minute or longer; stops under 5 minutes called small stops | Moves time between availability and performance |
| Breaks | Excluded from planned time; counted as downtime inside the shift | Changes the availability denominator |
| Planned downtime | Counted as a loss and an improvement opportunity; excluded so only unplanned stops count | Changes what OEE is allowed to improve |
The break convention alone moves the shift above. Counting the 30-minute break as downtime makes planned time 480 minutes and stop time 90 minutes. Run time stays 390 minutes, availability falls to 81.25%, and OEE falls to 67.7% against 72.2% before. Performance and quality do not change.
Total effective equipment performance (TEEP) uses a wider reference: all 24 hours of every day, 168 hours a week, where OEE uses scheduled production time only, per a continuous-improvement software guide. TEEP shows how much capacity the plant leaves unscheduled. OEE shows how well the scheduled time performed.
One rule follows. Pick one convention, document it, and hold it constant, because a comparison between two plants is only valid under the same convention. One OEE vendor makes the same point from the other side: comparing dissimilar equipment, products or conditions is usually problematic. The summary below restates the five inputs and the conventions that keep the figure comparable.
Summary of the calculation
The summary of the calculation reduces to five inputs and one rule. Planned production time and stop time set availability, total count and the ideal cycle time set performance, and good count sets quality. The product of the three is OEE, and good count times ideal cycle time divided by planned time returns the same figure. The inputs come from the shift calendar, the PLC state signal, a counter at the constraint, the constraint’s rated cycle and the checkweigher tally, while the three conventions stay fixed so the figure is comparable. The next section reads the finished figure.
Benchmarks give a direction, not a target
OEE benchmarks give a direction rather than a target, because the figure depends on industry, product and calculation convention. A score of 85% is called world class for discrete manufacturing, about 60% is fairly typical, and 40% is not unusual for a company that has just started tracking, according to a lean-manufacturing knowledge hub. A data-platform vendor places 80 to 90% in the very good band and states that no universal good value exists.
Two OEE vendors advise against chasing 85%. One sets stretch targets that are achievable within three to four months, and the other urges gradual, loss-specific improvement. A plant that starts at 60% or less gains more from a target of the next five points than from a distant benchmark.
OEE also ignores cost. Frequent preventive maintenance outside production hours, higher staffing or premium materials raise the figure without being economical, and larger batches cut setup time at the expense of lean flow, per a data-platform vendor. Focusing only on OEE invites overproduction, running equipment beyond its rated parameters and overstaffing, according to an OEE vendor’s implementation notes. For most Malaysian packing halls the first useful comparison is the same line against its own last quarter, under the same convention.
A single machine’s OEE still says nothing about the line it feeds. That question belongs to the constraint, which the next section takes up.
Benchmarks give a direction, not a target
Line-level efficiency applies the same arithmetic at the constraint
Line-level efficiency applies the OEE arithmetic at the constraint, the one step that governs the throughput of the line. An OEE vendor’s guide states that OEE should always be measured there, whether the step is filling, packing, stamping or assembling, and that other steps are measured as mechanical efficiency. Starved time (waiting for an upstream machine) and blocked time (waiting for a downstream one) appear at the constraint as down time. The guide advises attributing that time to the external equipment, so the constraint is not blamed for a neighbour’s stop.
A line-wide OEE combines several machines into one figure. A data-platform vendor notes that this shifts the meaning of the metric: it suits comparing sites and setting top-level targets, but it hides the causes of loss.
The line efficiency estimate, a close relative of OEE, multiplies the machine efficiencies, a method used in one conveyor maker’s line analysis. Take five machines at 93% (filler), 97% (capper), 95% (labeller), 99% (checkweigher) and 96% (case sealer). The product is 0.93 × 0.97 × 0.95 × 0.99 × 0.96, which is 81.4%. With the filler rated at 100 packs per minute as the constraint and the others rated faster, the unbuffered line delivers about 81.4 packs per minute (4,884 per hour). These are assumed figures, and the result is DNC’s arithmetic on the published method.
A buffer changes the OEE answer. An accumulation conveyor system holds packs while a neighbouring machine is repaired, so the filler keeps running. Output then moves from 81.4 toward the filler’s own 93 packs per minute and cannot exceed it, because line throughput never exceeds the constraint’s.
Production line efficiency has no single formula. Actual output divided by planned output gives 85% for 850 of 1,000 units, and a cycle-time method gives 83% for 600 units at 5 seconds in 3,600 seconds, per an MES vendor’s guide. The first result shows the outcome without the cause. OEE supplies the cause, which is why the three-factor form earns its extra inputs.
OEE asks how much time and rate the constraint keeps. Balance asks how evenly the work is shared across the stations.
Balance efficiency tests whether every station fits the takt time
Balance efficiency, unlike OEE, tests whether the work content of every station fits the takt time, the pace set by customer demand. Takt time equals available production time divided by customer demand: 480 minutes and 60 units give 8 minutes per unit, and a station that takes 9.5 minutes is the bottleneck, per lean-manufacturing guides. Production line balancing assigns tasks to stations so that no station exceeds that window.
Where OEE reads run-time losses, the minimum number of stations is total work content divided by takt time, rounded up. Balance efficiency is total work content divided by the product of the station count and the bottleneck cycle time, and one guide puts well-balanced lines above 85%. The table works an assumed five-station line through both formulas.
| Station | Before (minutes) | After moving 1.5 minutes of work from station 3 to 4 (minutes) |
| 1 | 7.0 | 7.0 |
| 2 | 7.5 | 7.5 |
| 3 | 9.5 | 8.0 |
| 4 | 6.5 | 8.0 |
| 5 | 7.0 | 7.0 |
| Work content | 37.5 | 37.5 |
| Balance efficiency | 37.5 ÷ (5 × 9.5) = 78.9% | 37.5 ÷ (5 × 8.0) = 93.75% |
At a takt time of 8 minutes the line needs 37.5 ÷ 8, or 4.69 stations, which rounds up to five. Station 3 exceeds the takt time by 1.5 minutes before the move and meets it after, a gap that OEE would not show because every station may run without a stop. Ranked positional weight suits manual lines with clear task precedence, the largest candidate rule gives a quick first pass, and software handles high-mix lines, per two balancing guides.
Balance and OEE measure different things. An imbalanced line shows as work-in-process piling up at one station and idle time everywhere else, and that pattern rarely appears in a utilisation report. A balanced line still loses OEE to stops, rejects and slow cycles at its constraint. Both readings return to what DNC specifies before a line is quoted.

Balance efficiency tests whether every station fits the takt time
Engineering recommendation for Malaysian packaging lines
DNC Automation’s recommendation for Malaysian packaging lines is to fix the five count points before choosing any OEE dashboard. A dashboard installed first displays a figure nobody on the floor can defend. The commissioning sequence below keeps every input traceable to a named machine.
- Place the OEE total-count sensor at the constraint machine, not at the fastest station.
- Take the stop time from the PLC machine-state signal and require an operator reason code above the agreed stop threshold.
- Write the ideal cycle time from the constraint’s nameplate rate and record the date it was set.
- Map every checkweigher reject to the machine that caused it, so the quality loss lands on the right line item.
- Document the three conventions in the line’s specification and keep them fixed.
Specified this way, the OEE figure at commissioning is the same figure the line reports a year later. The same five points also support a funding case. Industry4WRD scores machine data reported to a control layer, as laid out in the PLC, HMI and SCADA comparison, and it does not score a like-for-like machine swap. For your production line, talk to our engineers about fixing the count points before the next installation reaches commissioning. Questions about the 100% ceiling, benchmarks and whole-line figures follow.
Frequently asked questions about OEE calculation
The frequently asked questions about OEE calculation concern the 100% ceiling, the benchmark, the TEEP variant, the whole-line figure and the link to line balancing. Each answer below gives the rule first and the condition after.
Does OEE exceed 100%?
OEE does not exceed 100%. A result above 100% shows that the maximum rate used for the performance factor was set too low, which makes the ideal cycle time too slow.
What is a good OEE figure?
A good OEE figure is about 85% for discrete manufacturing, according to a lean-manufacturing knowledge hub, with about 60% typical and 40% common for plants that have just begun tracking. The right target depends on industry, product and convention.
How does OEE differ from TEEP?
OEE measures performance against scheduled production time, while TEEP measures it against all 24 hours of every day, which is 168 hours a week. TEEP therefore exposes unscheduled capacity that OEE ignores.
What is the OEE of a whole line?
The OEE of a whole line is read at the constraint, the single step that governs throughput. The line figure multiplies the machine efficiencies, and a buffer between machines lifts the result toward the constraint’s own efficiency.
How does line balancing relate to OEE?
Line balancing relates to OEE through the constraint. Balance efficiency checks that planned work is spread evenly across stations against the takt time, while OEE measures the stops, slow cycles and rejects that the constraint suffers at run time. A line needs both readings, because a balanced line still loses OEE and a high-OEE station still idles when the line is unbalanced.
- 0 views
- 0 Comment
Recent Comments