


ROI of Packaging Automation: What Actually Decides the Payback
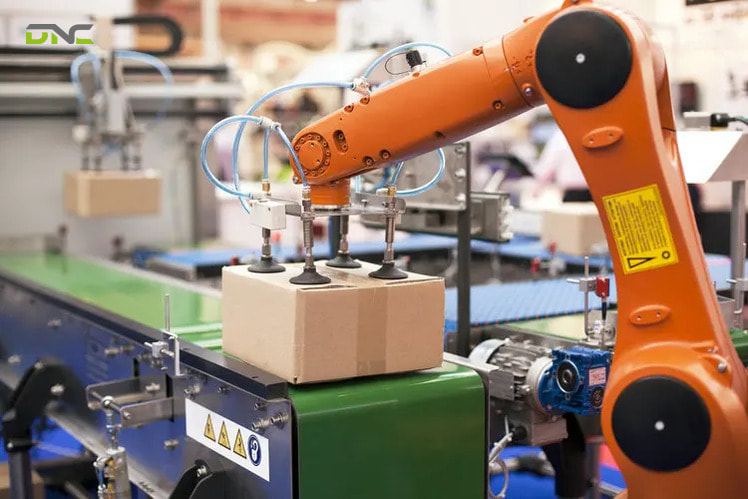
ROI of packaging automation is the financial return a manufacturer gets from automating a packaging line, measured against the total cost of getting there — expressed as a percentage or, more usefully for a capital-approval conversation, as a payback period. The formula itself is simple: annual benefit minus annual cost, divided by total investment. What actually decides ROI of packaging automation is not the formula but which costs and savings get counted, and manufacturers researched for this article repeatedly show that the models which look most attractive on paper are often the ones that left something out. DNC Automation specifies and commissions the checkweigher, carton sealing, palletizing and conveyor systems that a packaging automation investment actually buys on a Malaysian line, which is why the payback figure this article gives is grounded in DNC’s own equipment classes rather than a single blended industry average.
What Is ROI of Packaging Automation?
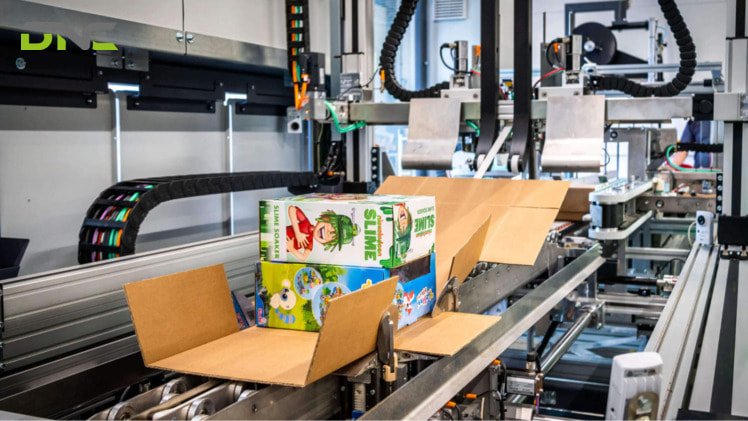
ROI of packaging automation is the return on investment calculation applied specifically to automating packaging operations — case erecting, sealing, labeling, wrapping, palletizing, and weighing. It is expressed most commonly as ROI (%) = (Annual Benefit − Annual Cost) / Total Investment, or as a payback period: how long it takes cumulative savings to recover the upfront cost. Both expressions use the same underlying numbers; a payback period is usually easier for a plant manager or CFO to weigh against a capital-approval deadline than a bare percentage is.
The calculation only means something if the inputs are real. Manufacturers researched for this article converge on the same warning from different angles: an ROI figure built on optimistic savings estimates and an underestimated cost base will clear the approval committee and then fail to hold up against the line’s actual performance a year later. That gap between the number on the proposal and the number the line actually delivers is where most of this article’s detail sits.
What Is ROI of Packaging Automation?
Which Metrics Actually Feed the ROI Calculation?
Closing that gap starts with knowing exactly which numbers the calculation is supposed to run on. Four metrics recur across the researched sources as what actually gets measured before and after a packaging automation project, rather than assumed. Throughput — units produced per hour or per shift — is the most direct driver: a line that packages more units without sacrificing quality unlocks capacity that converts straight into the benefit side of the formula. Downtime — total time a line is stopped for changeovers, faults, or routine maintenance — matters because even a modest reduction in unplanned stoppages recovers productive hours that a throughput number alone won’t show. Labor efficiency tracks how many operators a line needs and how many manual touchpoints get eliminated, which is usually the single largest line item on the benefit side. Scrap and rework — the material and labor lost to defects, mislabeling, or inconsistent handling — is the metric most often left out of a first-pass estimate, even though a lower reject rate compounds into real material savings over a full year.
None of these four numbers means anything without a documented starting point. A packaging line’s current throughput, downtime, labor headcount, and scrap rate all need to be recorded before automation goes in — not estimated afterward from memory — because the entire ROI claim rests on proving the after-state against a real before-state, not a guessed one.
What Does the Initial Investment Actually Include?
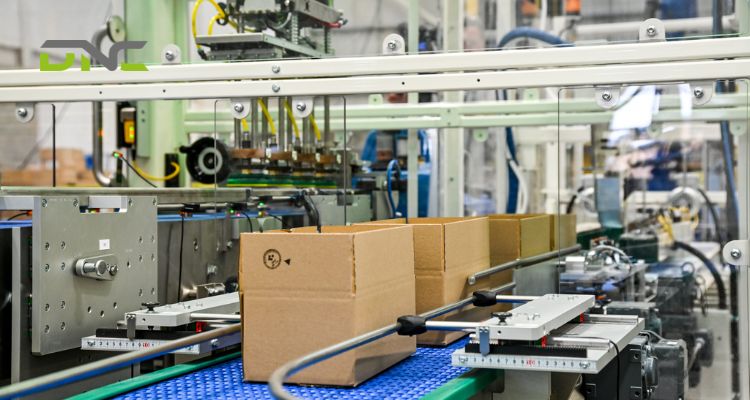
Recording those four metrics only produces a usable before-and-after comparison if the other side of the equation — what the project actually costs — is complete too. The initial investment in packaging automation is not just the price on the equipment quote. Manufacturers researched for this article repeatedly flag the same gap: integration work, installation, operator training, and ongoing support all sit on the cost side of the equation, and a project that looks attractive on paper can lose that advantage fast if it also needs a line redesign, suffers a longer-than-planned startup, or requires more retraining than budgeted. Additional material handling equipment, utility upgrades, or facility changes needed to support the new machine belong in the same total, not treated as a separate, unbudgeted surprise once the equipment arrives.
Getting the investment side complete before the ROI calculation runs is what keeps the payback estimate honest. A total that only reflects the equipment line item will always show a faster payback than the line will actually deliver, which is exactly the gap a capital-approval committee discovers the hard way once the real invoices start arriving.
What Does the Initial Investment Actually Include?
How Much Do Labor Savings Actually Contribute — and What Do They Leave Out?
With the investment total complete, the benefit side of the formula is where most of the payback actually gets claimed — and labor is where nearly every researched source starts. Labor-cost reduction is the most commonly cited driver of packaging automation ROI across the researched sources, and it is also the one most often treated as the whole picture when it is only part of it. One vendor’s own published framing puts this plainly: financial models that focus solely on labor cost reduction miss the true financial impact, which also includes eliminating the hidden costs of manual operations — employee turnover, material waste, production bottlenecks, and safety risk. Labor savings are real and usually substantial, but a model built on labor alone tends to overstate how fast the investment actually pays back, because it ignores the other cost categories automation also removes.
For a Malaysian packing hall, labor cost is the figure worth grounding in local numbers rather than a vendor’s own published example from a different country. A manual palletizing station typically runs 4 to 6 workers per shift, at a fully burdened cost — wages plus EPF/SOCSO — in the RM 4,500 to RM 6,500 per worker per month range, the same labor baseline covered in more depth in Manual vs Automated Palletizing. That figure, not a US or China case study’s dollar amount, is the labor-side input that actually applies to a Malaysian manufacturer running this calculation.
Which Costs Get Missed in a Packaging Automation ROI Calculation?
The costs most often missing from a packaging automation ROI calculation are the operating costs that only show up once the line is actually running, not the ones on the equipment quote. Labor is the largest single number on the benefit side covered above, but it is far from the only place the calculation goes wrong — the cost side has its own recurring blind spot. Electricity, compressed air, cooling water, and the downtime that comes from short machine stops and routine adjustments all add up over a year, and one detailed cross-region analysis researched for this article names exactly this gap as the single most common ROI-calculation error for end-of-line automation.
Two further costs compound the same gap. The transition period between a manual process and a fully automated one is not instantaneous — employees need time to acclimate to new equipment, and the productivity dip during that ramp-up period is rarely built into the original ROI estimate, which inflates the payback expectation set at approval time. Ongoing maintenance and periodic upgrades are a second recurring cost that a first-pass calculation tends to underweight against the one-time cost of recruiting and training a manual-process operator, even though maintenance is a permanent line item and hiring cost is not. A calculation that accounts for operating cost, transition dip, and maintenance from the start is the one that still matches reality a year after commissioning.

Which Costs Get Missed in a Packaging Automation ROI Calculation?
So Far: What Actually Decides Whether Packaging Automation Pays Off?
What decides whether packaging automation actually pays off is not any single number but how completely the calculation is built. The metrics that feed the ROI calculation — throughput, downtime, labor efficiency, scrap and rework — only produce an honest number if the investment side is complete and the commonly missed costs are counted from the start. Labor savings are the largest single driver but not the whole picture; operational costs, the transition-phase productivity dip, and ongoing maintenance are the categories that most often separate a proposal’s promised payback from the line’s actual one. What still needs answering is what payback period a Malaysian manufacturer should actually expect for a given equipment class, which mistakes turn an honest calculation into an inflated one, and — the part none of the researched vendors connect for their own equipment — how the answer changes once weighing and inspection accuracy become part of what the automated line has to deliver.
What Payback Period Should a Malaysian Manufacturer Actually Expect?
The payback period for a Malaysian manufacturer’s packaging automation project depends heavily on which equipment class is being automated, which is why a single blended industry figure is less useful than a per-equipment-class anchor. None of the researched sources publish a genuinely general, Malaysia-applicable payback figure for packaging automation as a category — what exists instead are single-facility case studies from non-Malaysian sites, illustrative worked examples explicitly framed by their own authors as teaching tools rather than real data, and one vendor’s own general claim that businesses typically see full ROI within one to three years.
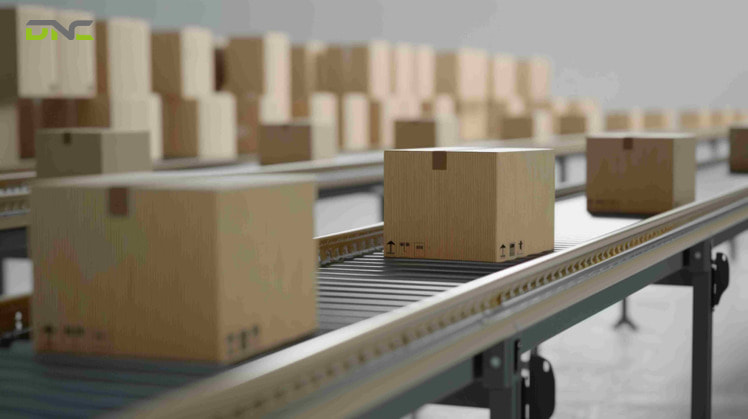
DNC’s own equipment-class figures, drawn from projects across Malaysian manufacturing, are the more useful anchor. A checkweigher station typically pays back in under 12 months, driven by overfill recovery and avoided recall cost — a fast payback because the savings mechanism is direct and continuous from day one. By contrast, warehouse automation involving ASRS integration typically runs a longer 2 to 4 year payback for mid-volume Malaysian manufacturing applications at current labor costs, reflecting the larger capital outlay and the more gradual way throughput and labor gains accumulate across a full warehouse operation rather than one station. A packaging-line automation project sized between those two — a case sealer, a palletizing cell, a conveyor upgrade — will typically land somewhere between those two anchors, closer to the checkweigher end where the automated station replaces a specific, high-frequency manual task, and closer to the ASRS end where the project involves redesigning a larger section of the line.
What Payback Period Should a Malaysian Manufacturer Actually Expect?
What Mistakes Turn an Honest ROI Calculation Into an Inflated One?
The same handful of mistakes recur across the researched ROI methodologies, and each one independently inflates the payback promise a capital-approval proposal makes. Even the right payback anchor for the right equipment class, from the figures above, gets undermined if the calculation feeding it repeats this same pattern of errors. Skipping baseline data — not documenting the line’s actual throughput, downtime, labor count, and scrap rate before automating — makes it impossible to prove afterward how much of the improvement automation actually caused versus a temporarily favorable operating condition. Treating equipment speed as the only success metric misses that a faster machine does not automatically produce better economics if downstream bottlenecks, quality issues, or long changeovers absorb the gain. Underestimating implementation cost — covered above — is the most common way a genuinely sound equipment choice still produces a payback estimate the line can’t match. And failing to account for future growth compounds the comparison unfairly: staying manual as volume grows usually means adding headcount and labor cost that a static, single-point-in-time ROI comparison never captures.
A calculation built without these four gaps holds up under the scrutiny an approval committee will eventually apply anyway, whether that scrutiny happens before the purchase order or a year after it.
What Mistakes Turn an Honest ROI Calculation Into an Inflated One?
Why Does the ROI Calculation Change Once Weighing and Inspection Accuracy Are Part of the Line?
None of the packaging automation manufacturers researched for this article connect their own ROI methodology to what happens once a checkweigher or inspection station sits downstream of the equipment they’re selling. A calculation built without the four mistakes covered above still stops short on this one point, since none of the researched vendors account for it at all. Every ROI framework on this SERP stops at throughput, labor, and scrap, treated as properties of the automated station itself. But on a line DNC integrates end to end, a case sealer, palletizer, or conveyor’s own construction and calibration quality is not a separate line item from the checkweigher’s accuracy three stations later — it is an input to it. A poorly sealed case or an unsquare pallet load changes how consistently a product presents itself to an in-motion weighing or inspection station downstream, and an inaccurate reading there is not just a quality problem; for Malaysian food and export manufacturers, it is a compliance-documentation problem that carries its own cost the upstream equipment’s own ROI model never counts.
That is the practical argument for treating packaging automation ROI as a line-level calculation, not a station-by-station one: DNC’s engineers size a checkweigher station against the upstream automation feeding it, which is also why DNC’s own payback figures are quoted per equipment class rather than as one blended packaging-automation number — the checkweigher’s fast, direct payback and the packaging line’s slower, throughput-driven payback are two different financial mechanisms sitting on the same line, not one number.
How Does This Apply to a Malaysian Manufacturing Decision?
Applying that line-level view to an actual Malaysian manufacturing decision still requires real local numbers, not a vendor’s generic example. Malaysian manufacturers evaluating packaging automation ROI face two local factors none of the researched vendor sources, all non-Malaysian, account for. Labor cost — the largest single ROI driver across every source researched — needs to be built from the RM 4,500-6,500 per worker per month range covered above, not a US or China case study’s dollar figure, since the entire benefit side of the calculation scales off this number. And under Malaysia’s NIMP 2030 national investment framework, government incentives currently favor manufacturers automating within the current adoption window, which shifts the effective payback calculation in a direction none of the nine researched sources’ ROI models were built to include, since none address Malaysian government incentive structures at all.
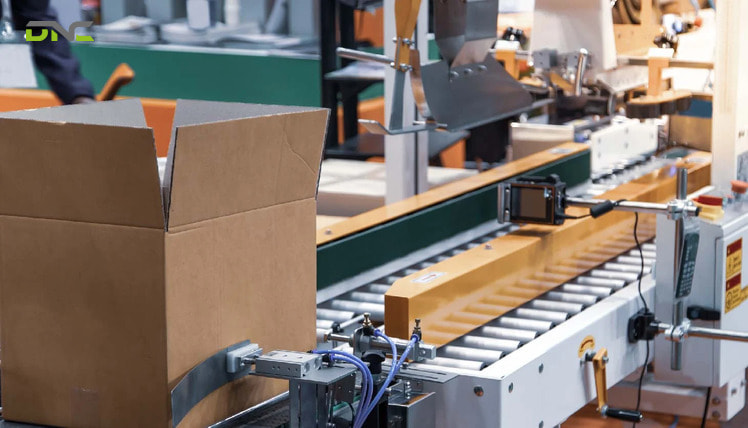
A manufacturer evaluating whether to automate a specific station — rather than the whole line at once — gets a more accurate ROI picture by comparing that station’s own payback class (checkweigher-fast, ASRS-slow, or somewhere between for general packaging automation) against the labor cost it actually pays today, rather than applying one industry-wide payback assumption to every piece of equipment on the line.
How Does This Apply to a Malaysian Manufacturing Decision?
What Do Buyers Ask About Packaging Automation ROI?
These frequently asked questions about packaging automation ROI cover the calculation, timeline, and cost details that come up most often once a manufacturer moves from general interest to building an actual capital-approval case.
How long does it take to recoup a packaging automation investment?
How long it takes to recoup a packaging automation investment varies by equipment class rather than following one industry-wide number: a checkweigher station typically pays back in under 12 months, while warehouse automation involving ASRS integration typically runs 2 to 4 years for mid-volume Malaysian manufacturing at current labor costs. General packaging-line automation usually falls between those two anchors.
Is packaging automation ROI worth calculating for small-scale production?
Yes, provided the products and operations are standardized and repetitive enough to automate at all — the ROI mechanism (labor savings, reduced waste, better throughput) applies at smaller scale, though the absolute payback period depends on how much manual labor and waste the automation actually replaces.
What costs get most commonly missed in a packaging automation ROI calculation?
Operational costs (electricity, compressed air, cooling water), the transition-phase productivity dip while employees adjust to new equipment, and ongoing maintenance are the three cost categories most often left out of a first-pass ROI estimate, according to research into cross-region automation cost analysis.
Does packaging automation ROI only come from labor cost savings?
No — labor cost reduction is the most commonly cited driver, but hidden-cost elimination (employee turnover, material waste, production bottlenecks, safety risk) contributes independently, and a calculation based on labor savings alone typically understates the total benefit.
- 5 views
- 0 Comment
Recent Comments